The arrival of an electron microscope improved our vision by a factor of one million. Humans could finally see atoms.
I just released a short study on Nasdaq data that hopes to make a similar leap by studying trades at nanoseconds, a million times more precise than often used milliseconds. It enables one to see asset re-allocations among rapid-fire tradebots. Twenty percent of trades arrive in sub-millisecond clusters.
Zooming in on these clusters one observes patterns suggestive of liquidity-demanding tradebots, HFT or non-HFT, waiting for new limit orders and snapping them up as they come. The clusters exhibit higher adverse-selection cost for these limit orders but no price instabilities.
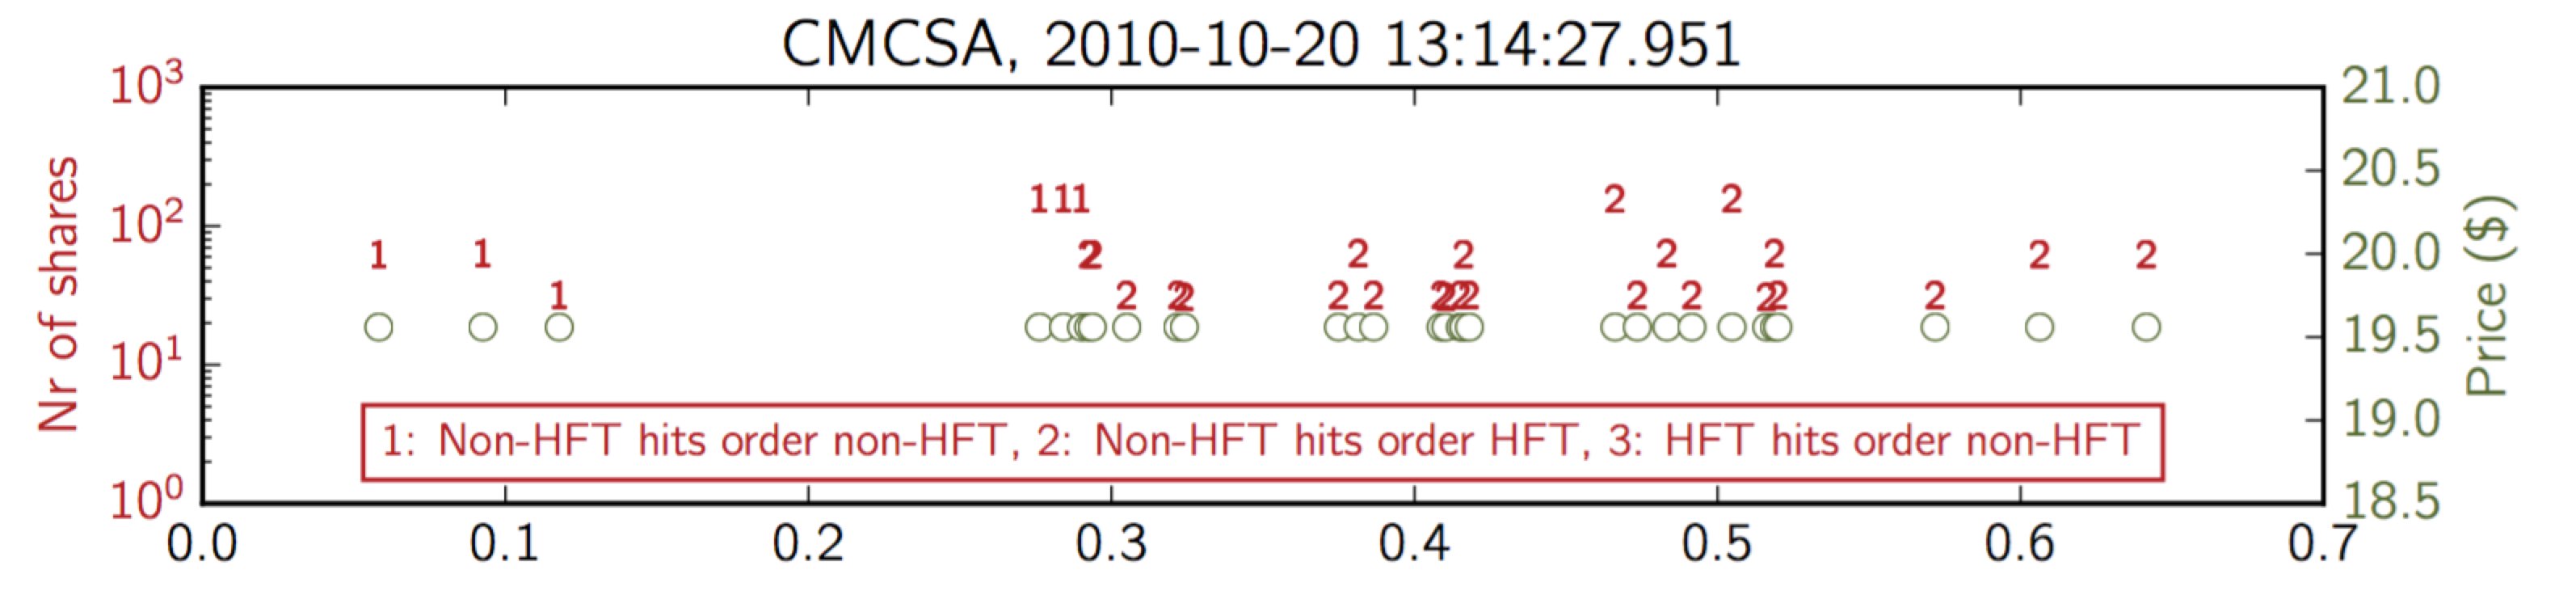
The following graph zooms in on the most crowded millisecond. It shows the 30 trades executed in the Comcast Corporation stock during the 951th millisecond of October 20, 2010, 13:14:27.
The graph is informationally dense as there are essentially two graphs merged into one. The graph shows trade size in red (left y-axis) and trade price in green (right y-axis). And, rather than use a standard dot to indicate trade size, the graph uses an integer as a marker to indicate what the nature of the trade was in terms of who traded with whom.
The graph shows that all trades were done at the exact same price. The top graph suggests a non-HFT using an algo to consume price quotes optimally (i.e., limit orders), first the ones provided by other non-HFTs and, later on, quotes provided by HFTs. It suggests HFTs were replenishing the order book after non-HFT price quotes were consumed, potentially sourcing them from another market by hitting price quotes there.
Admittedly, the study covers only one month of trade data (October 2010) but could easily be extended to cover a longer period or other asset classes. The reason for this being relatively straightforward is that trade data with some level of trader identification is manageable in terms of sample size. The analysis did not use quote data which would make the sample an order of magnitude larger. A combined trade and quote dataset would yield richer insights but comes at the cost of big-data complexity with potentially subjective choices on how to shrink the sample before analysis becomes possible. Moreover, of the two types of data, one could argue that trade data is economically more valuable as it represents actual transfers between traders.
The overarching message of the study is that, in addition to its actual empirical results, the analysis serves to demonstrate that nanosecond data can be processed meaningfully even in regulatory institutions that typically do not have the hard- and software to deal with big-data challenges.
P.S.: The paper is here.