Bidding is not gratis. In the old days, a bidder needed to stay around on the trading floor to wait for someone to “bite.” An economist would call this the opportunity cost of his time.
Bidding remains costly in modern markets, albeit much less so. The opportunity cost of a computer who does the bidding is much, much lower, but not zero. Furthermore, the exchange that processes the bids will charge if these bids do not result in enough trades. If a participant’s order-to-trade (read, bid-to-trade) ratio exceeds some threshold, he will be charged a fee.
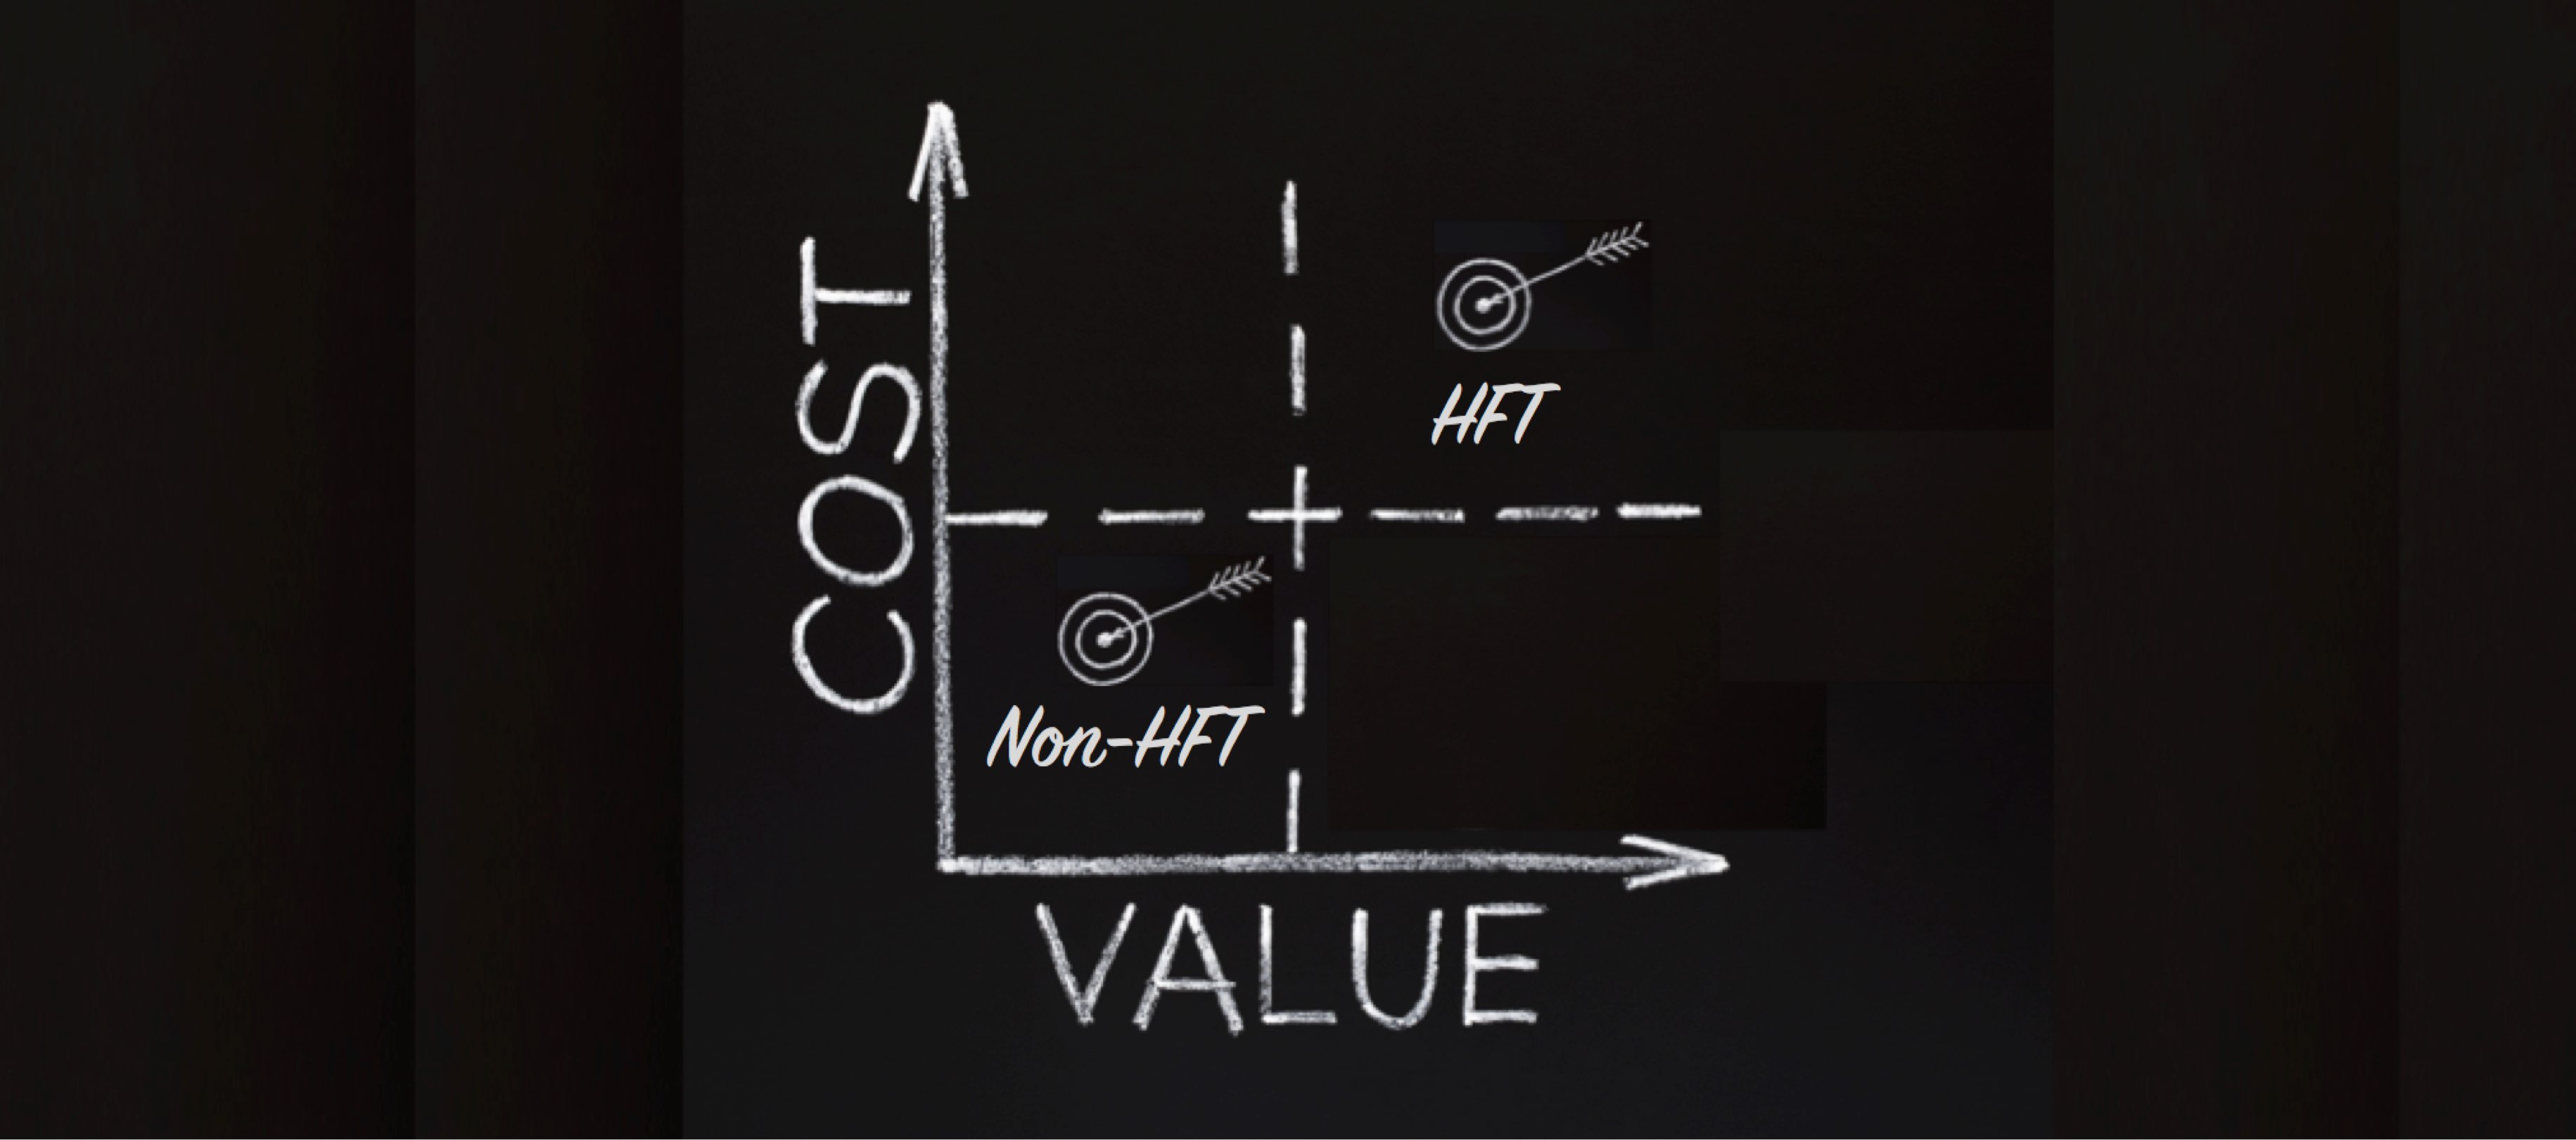
Long story short, the new version of my costly bidding paper with Boyan Jovanovic (NYU) analyzes bidding by high-frequency traders (HFTs) and non-HFTs thoroughly. We have extended the model in our earlier paper by allowing for two types of bidders, a low-cost-low-value (low) and a high-cost-high-value (high) type. They differ in how costly bidding is for them, but also in how valuable it is for them to be the highest bidder and get the asset.
The extension generates an important new insight. If both types co-exist, then high types bid more aggressively – they bid closer to the maximum they are willing to pay (i.e., their reservation value). Technically, they draw their bid from an upward sloping density function. The low types on the other hand, bid carefully, potentially so careful that their density function becomes an inverted U. The intuition for this result is that the very fact that their cost of bidding is lower makes them less sensitive to losing the bidding contest. (Note that this result does not rely on an information asymmetry friction, it holds even in the absence of such friction and appears robust to adding it.)
When taking this new model to the data, HFTs turn out to be the high types. We estimate the model on the workhorse Nasdaq HFT data that has been used in many academic studies. To the best of my knowledge all of these studies use trade data, none use the order-book snapshots that are also in there. These snapshots reveal the best ten bids, and for each of them whether they were done by HFTs or by non-HFTs.
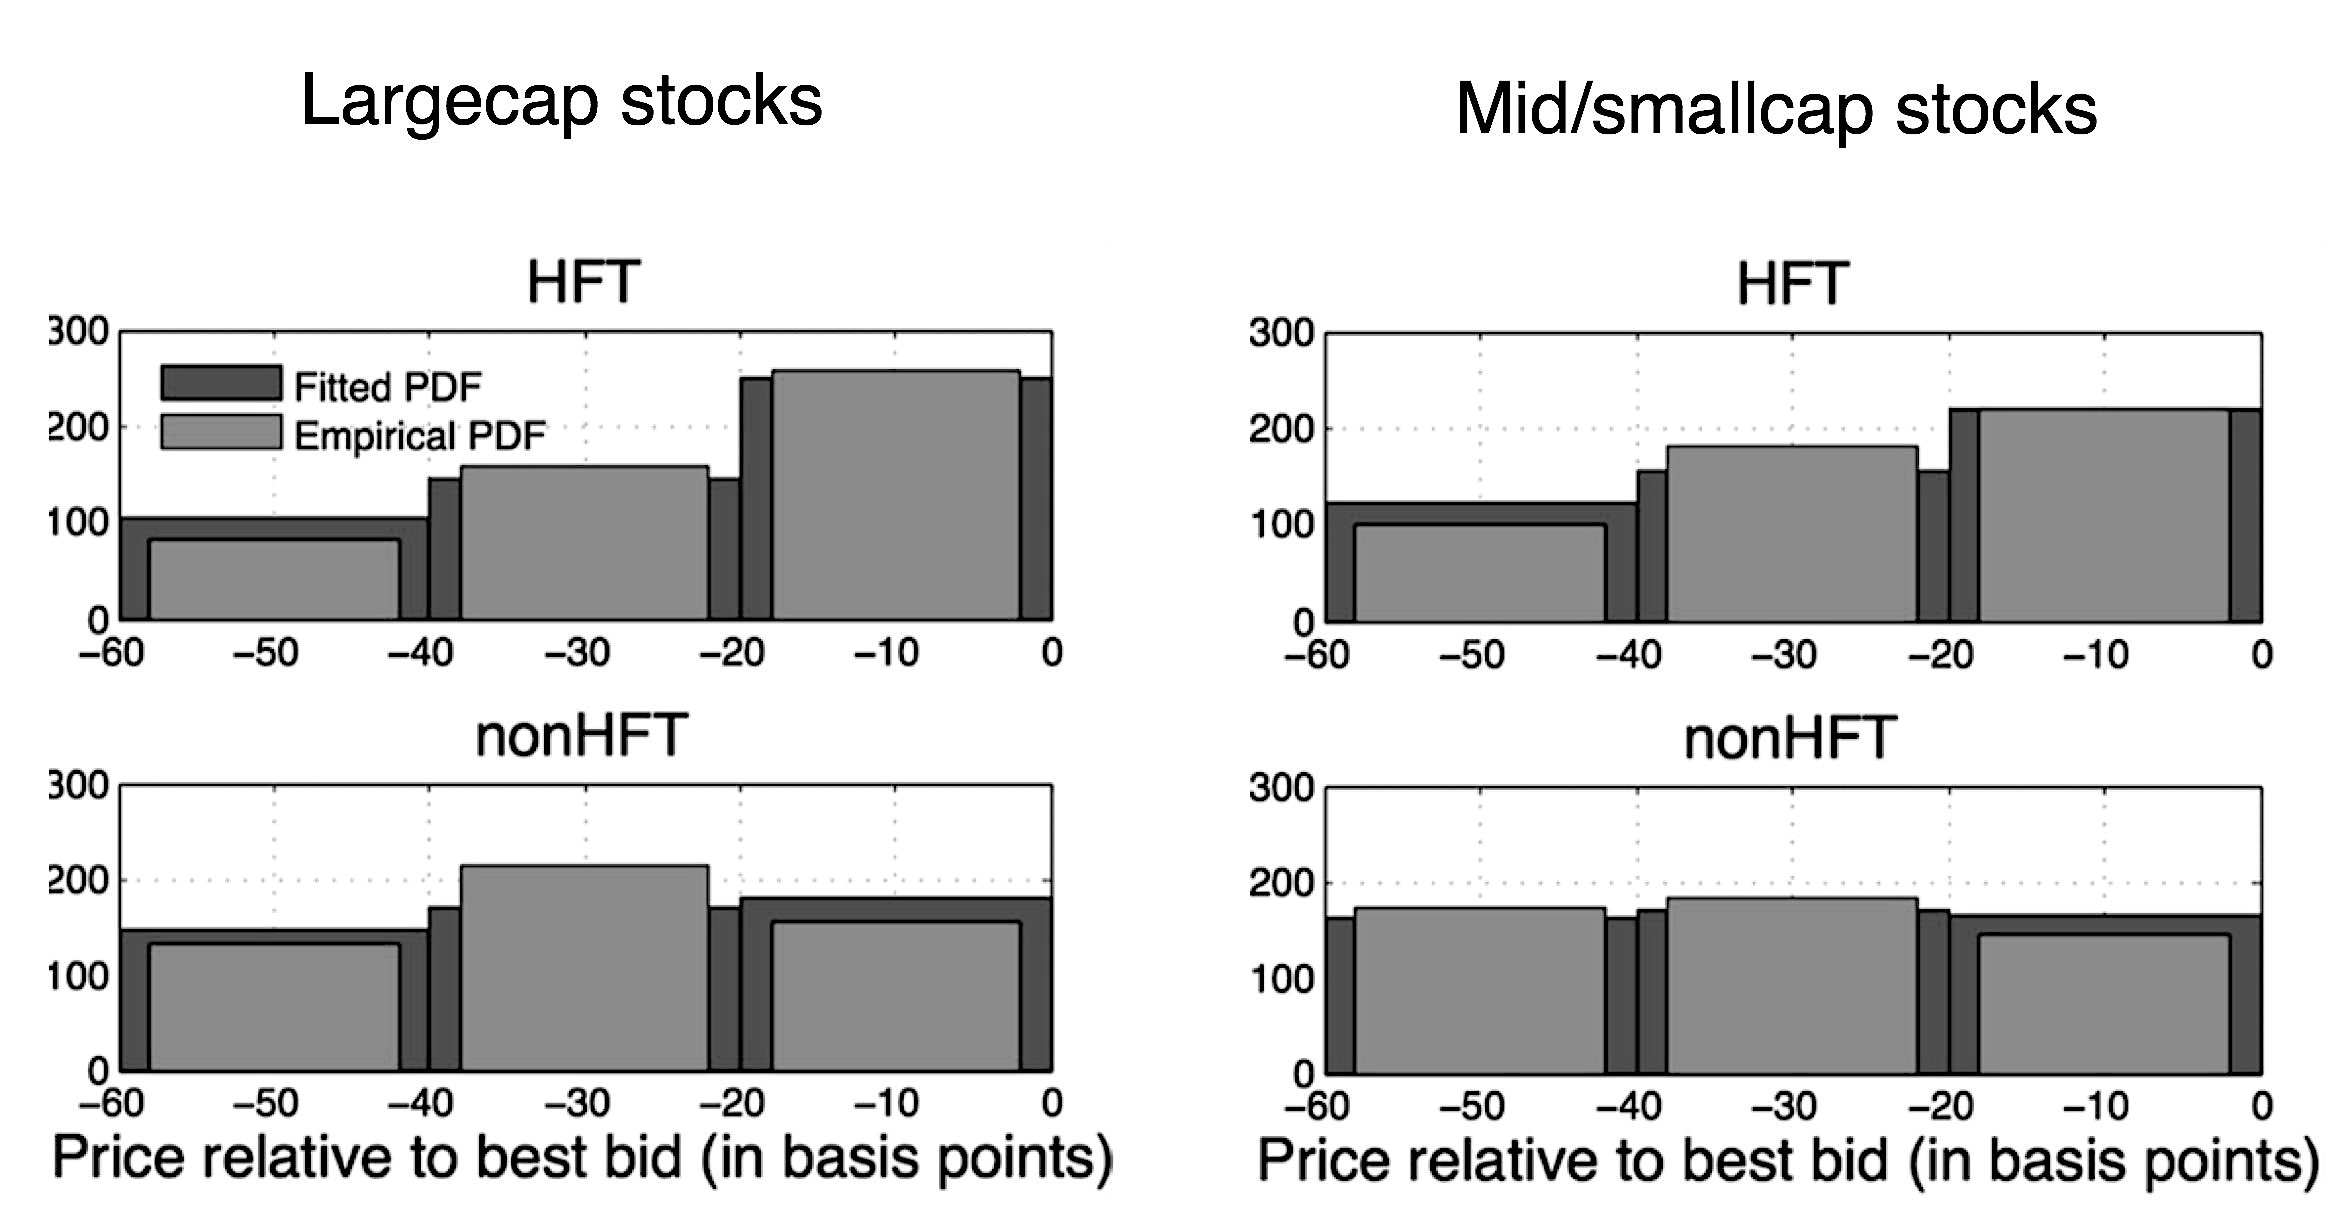
Above is the signature graph of the empirical part of the paper. The left-hand side plots pertain to largecap stocks, the right-hand side plots to mid- and smallcaps. The top graphs show the bid-price dispersion for HFTs, the bottom graphs for non-HFTs. Each plot illustrates both the raw-data bid dispersion and the dispersion implied by the fitted model. So, what do these plots tell us?
In summary, if in an extremely simple first-price auction, one switches on a (tiny) bidding cost, a very rich equilibrium pattern emerges. This pattern can be characterized in closed form and appears to fit the bidding patterns witnessed in real-world markets remarkably well.
P.S.: The new version of my bidding paper with Boyan Jovanovic (NYU) is here.