Perhaps this blog post is.
Fake news. How do we tell information from merely gossip? How do we separate the wheat from the chaff? Or, closer to home, how do we know which dealer is most informed, and how the information is learned?
It has long been one of my personal ambitions as an econometrician to map out the information process in a dealer community. Existing studies focus on dealer networks where connections are based on transactions: Who traded with who? There are many interesting and relevant results, but none on information revelation. I believe one reason is that information travels too fast to be detected in low-frequency transaction data, it requires high-frequency quote data.
Today Björn Hagströmer and I released a paper that characterizes the process of information revelation based on dealer quote streams. Every tenth of a second we take a snapshot of the EUR/CHF quotes by eight large global dealers. We also include quotes published by a large inter-dealer platform: EBS. The data period further includes the EUR/CHF crash in January 2015.
Now, how do we identify whether a change in a particular dealer’s quotes is information-driven or just noise? We follow in the footsteps of Hasbrouck (1995, JF) and essentially peek into the future to see where a price settles after a typical price shock. Hasbrouck developed the statistical approach to determine the origin of information, our goal is to characterize the full process of how information gets revealed. In particular, can we measure dealer connections? If so, do better connected dealers learn more quickly? And, is information revelation faster when there is a public signal (i.e., a news release)?
The answers to these questions we believe are interesting as they test certain predictions from recent network theory. For example, one result that may sound counter-intuitive is that information revelation is slower when there is news. Volatility is controlled for which rules out the simple answer that there is more to be learned at a time of news (i.e., higher volatility). Our finding however is consistent with theory that explains it through reduced incentives to discover any remaining non-public information in a news interval.
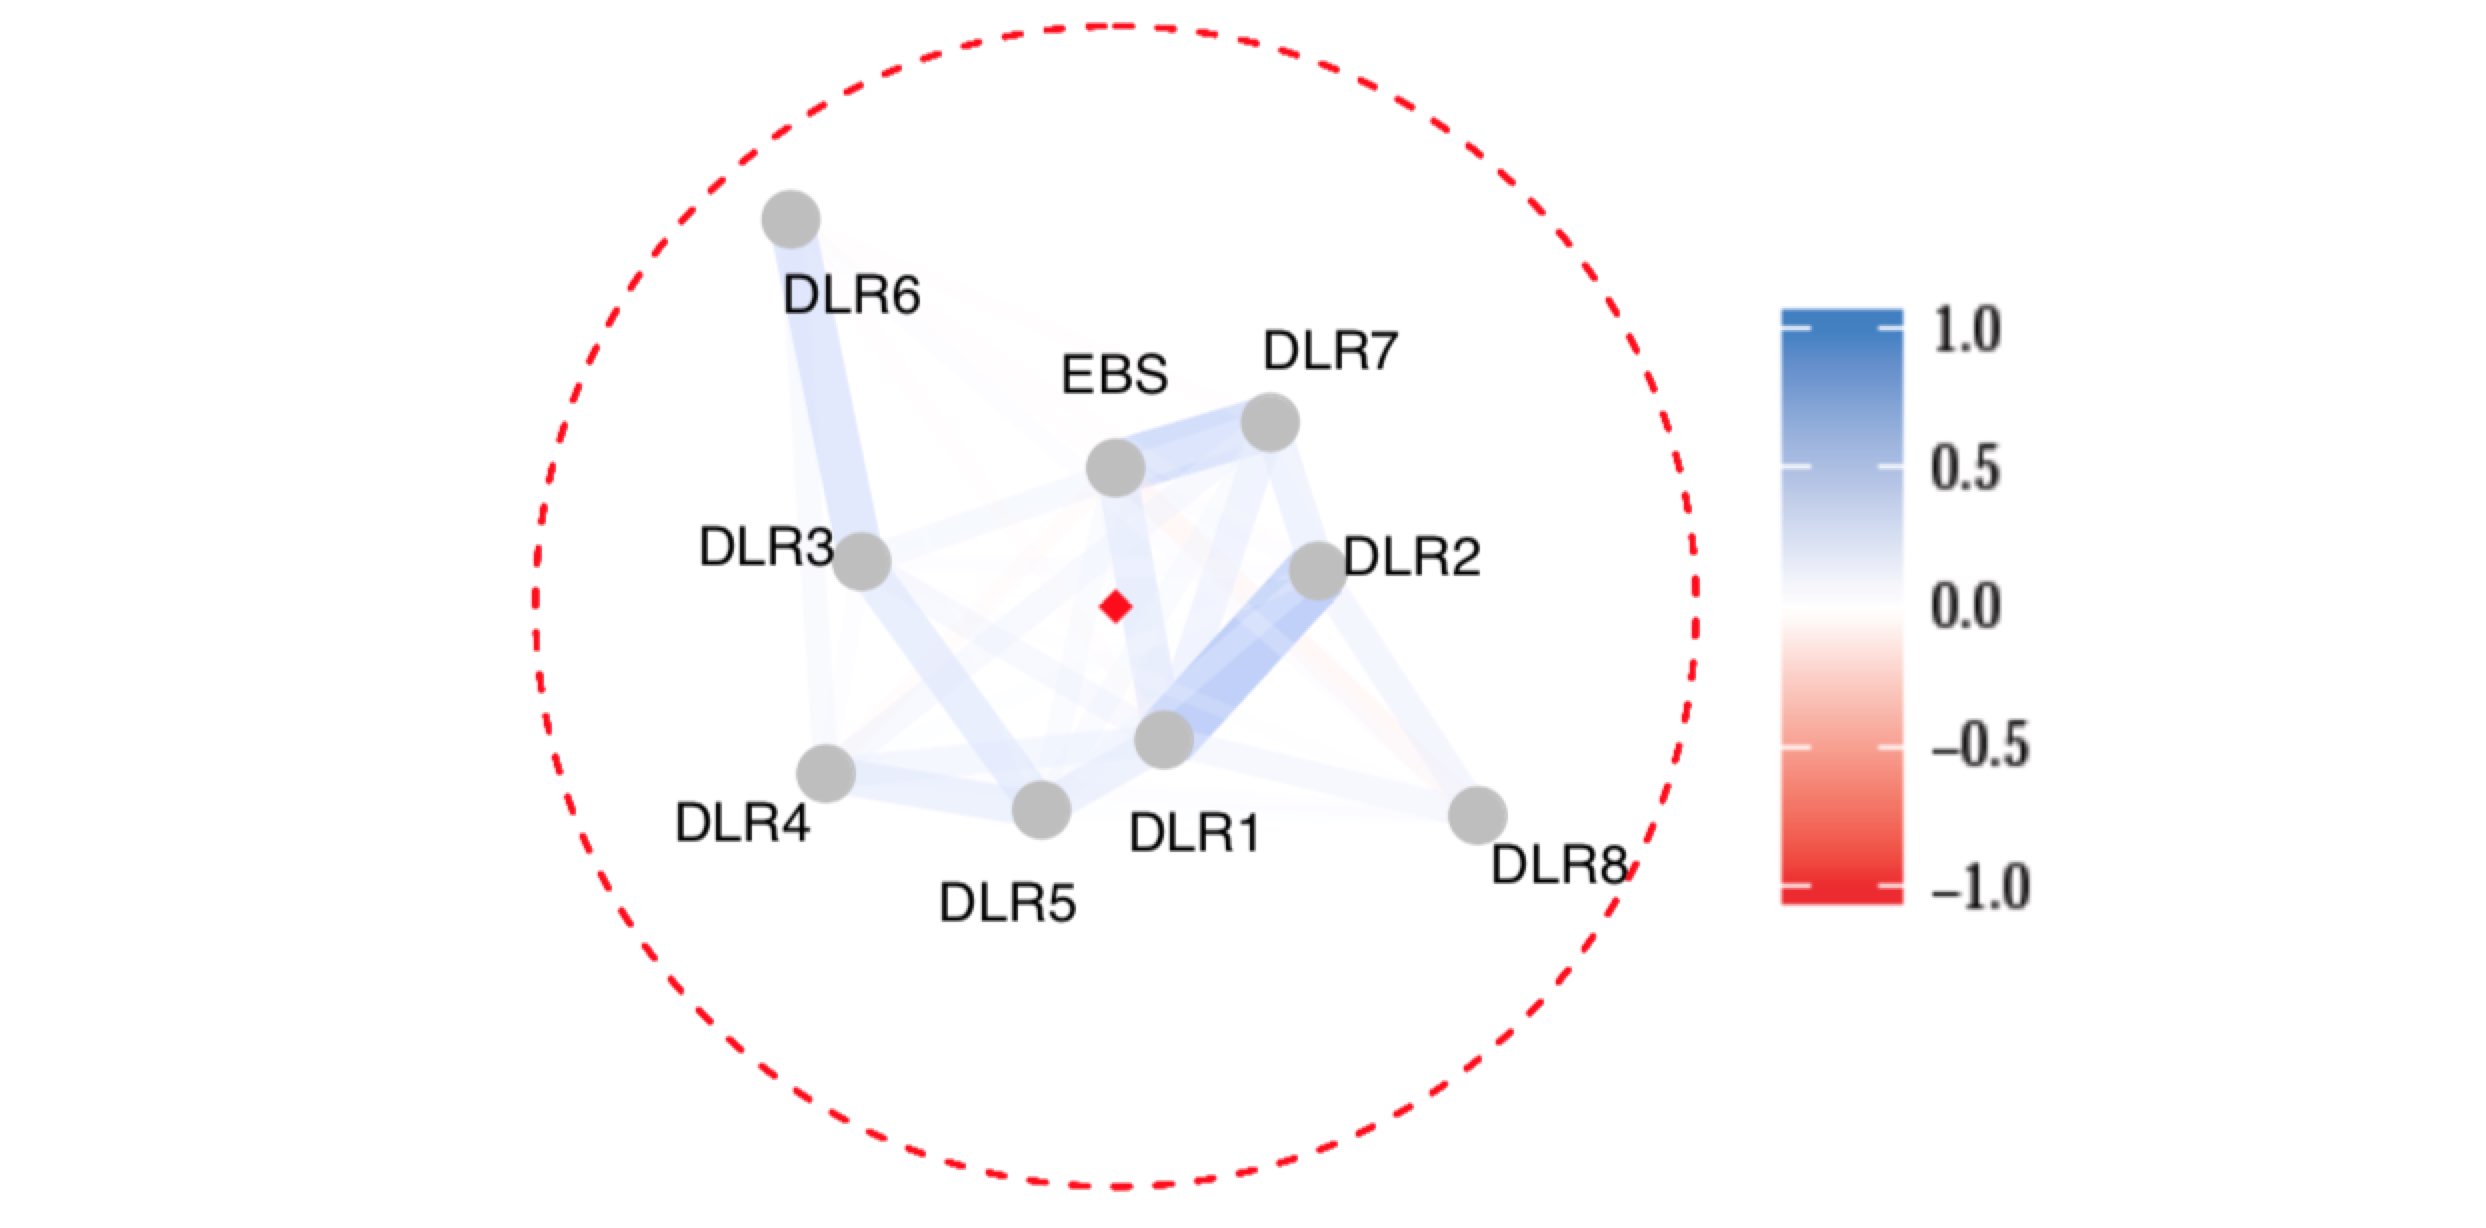
We further believe that the way we construct information-revelation maps is a useful innovation. These maps are straightforward to produce as they require only simple linear regressions. The signature plot below is an example of such a network map taken half a second after a price shock. All dealers (DLR1-8) started from the dashed circle and are on their way to the central diamond. They will arrive there once their quote reveals all the information in the shock.
The graph leads to a couple of observations. First, it testifies to the high speed of information revelation. The clock has not even moved a second, yet the quotes of several dealers and EBS reflect more than half of the information already. Second, strongly connected dealers (e.g., DLR1, DLR2, and DLR5) seem more informed. Third, it is not true that the inter-dealer platform EBS dominates price revelation. DLR1 and DLR2 seem equally close to center.
We further analyze how the network forms on the day of the EUR/CHF crash. We leave that as a cliff hanger.
And, was this blog post fake news? Not in our minds as we believe the paper makes solid contributions to the literature, both economically and methodologically. However, to be really sure I guess you will have to follow the Twitter stream on #InformationRevelation.
P.S.: The paper is here. It is a significantly revised version of “A Network Map of Information Percolation,” both in terms of the economic content and in terms of the empirical methodology. (The latter is inspired by current research in medicine on information processing in neural networks, including the human brain.)