
In his 1889 book, Natural Inheritance, Sir Francis Galton takes particular interest in measuring variability. His writing is precise and inviting. Right from the start, he is focused on measuring variability. At some point, he declares his love for distributions (p. 62):
The Charms of Statistics. – It is difficult to understand why statisticians commonly limit their inquiries to Averages, and do not revel in more comprehensive views. Their souls seem as dull to the charm of variety as that of the native of one of our flat English counties, whose retrospect of Switzerland was that, if its mountains could be thrown into its lakes, two nuisances would be got rid of at once.
Distributions is what we have been thinking about, long and hard, when revising our manuscript on Nonstandard Errors (with our facial expressions resembling Sir Francis’). When 164 research teams independently test hypotheses on the same data set, their estimates form a distribution. The variability in estimates is what we are interested in.
The simple fact that there is no standard path to do the empirical analysis creates variability in estimates across teams. We pick the interquartile range as a robust dispersion measure and refer it as nonstandard error (NSE). Note that the adjective, nonstandard, emphasizes the lack of a standard approach. In other words, if all researchers agree on one path being the most reasonable one, then NSE is zero.
We use quantile regressions to study how NSEs relates to quality variables. Is dispersion simply the result of the presence of lower quality estimates? The regression results show that this is only partially true. The results are depicted in one of our signature plots:
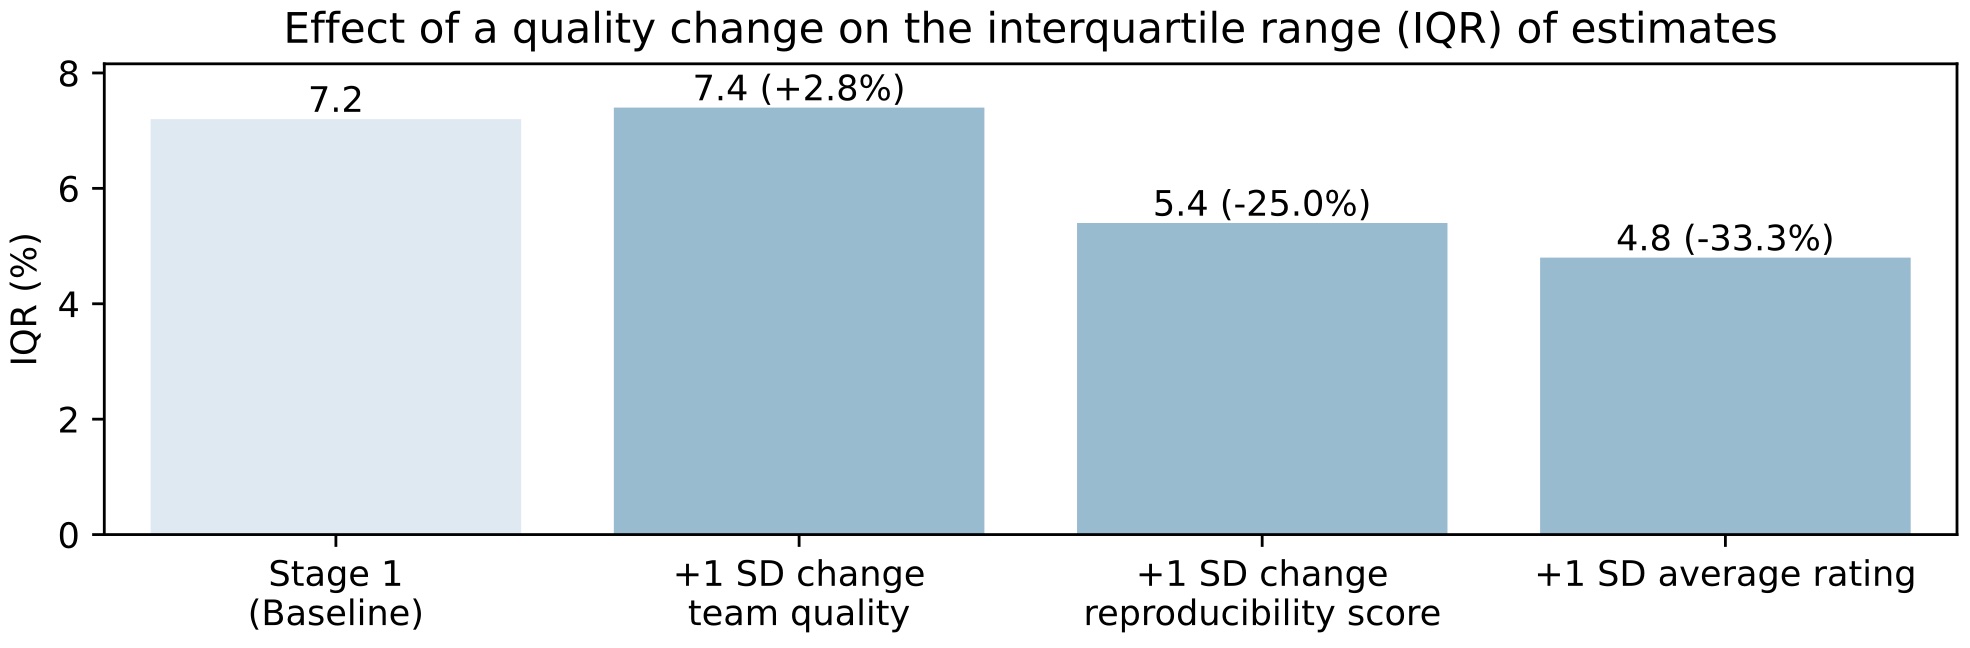
The plot shows that a one standard deviation (SD) increase in the ease with which a team’s results can be reproduced by others trying to run their code, coincides with a 25.0% lower NSE. A one SD increase in the rating of the team’s paper as provided by peer evaluators, coincides with a 33.3% lower NSE. These are based on statistically significant results.
A one SD increase in team quality, however, coincides with higher NSE, albeit small in size: +2.8%. Team quality is a summary measure that is based on five underlying team quality attributes. If one relates each of these attributes separately to NSE, then the presence of an associate or full professor, or a team of two instead of one, coincides with a 19.4% and 12.5% lower NSE, respectively. However, a one SD increase in top publications realized by the team, coincides with higher NSE: +26.4%. Interesting, no?
Our results further show that adding peer feedback stages reduces NSE by almost 50%. And, researchers seem to understimate the size of NSE, which, hopefully, they will no longer do after learning about our results.